What makes a good map? Who creates the maps we use every day? Do the maps we rely on actually reflect the spaces we occupy, and the public resources we depend on?
These are a few of the questions that BetaNYC’s Mapping for Equity project asks, out loud, with community.
In 2025, Mapping for Equity had a big year. We hosted fourteen sessions across all five boroughs, with nine hands-on field mapping events in parks and five data entry workshops that turned observations into open, reusable public data.
What is Mapping for Equity?
Mapping for Equity (M4E) is a civics and data literacy program that teaches the public how to see data in the world around them, and then contribute to OpenStreetMap, a freely editable world map. The goal is simple: empower anyone to document local public resources, and use what they find to advocate for more equal, more accessible open spaces for all.
M4E began as a focus project within the Civic Innovation Fellowship, BetaNYC’s program dedicated to training the next generation of civic leaders. Over successive cohorts, we transformed our curriculum and event production “know-how” into a public-facing toolkit that anyone can use.
The goal with M4E is to empower anyone to do this work in their own spaces, and use what they find to advocate for more equal open spaces.
How it Works
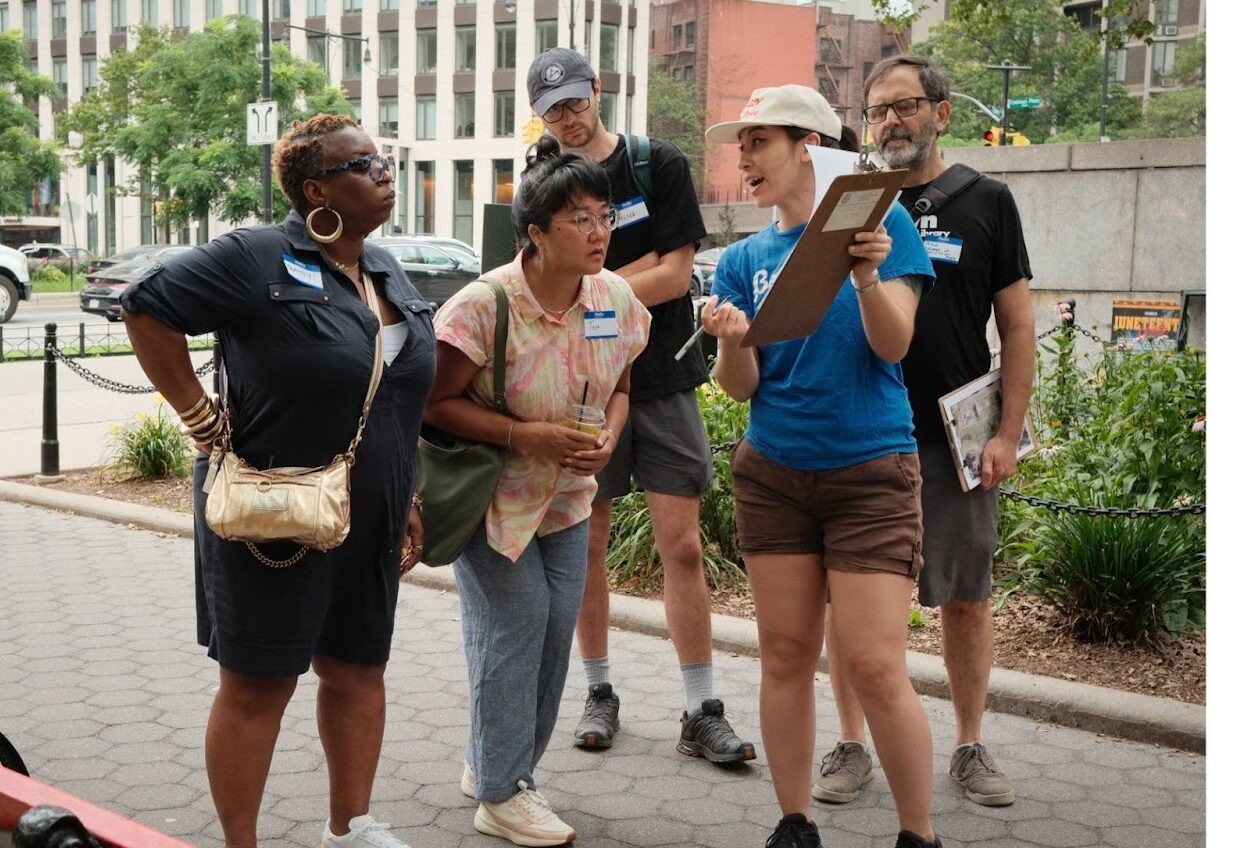
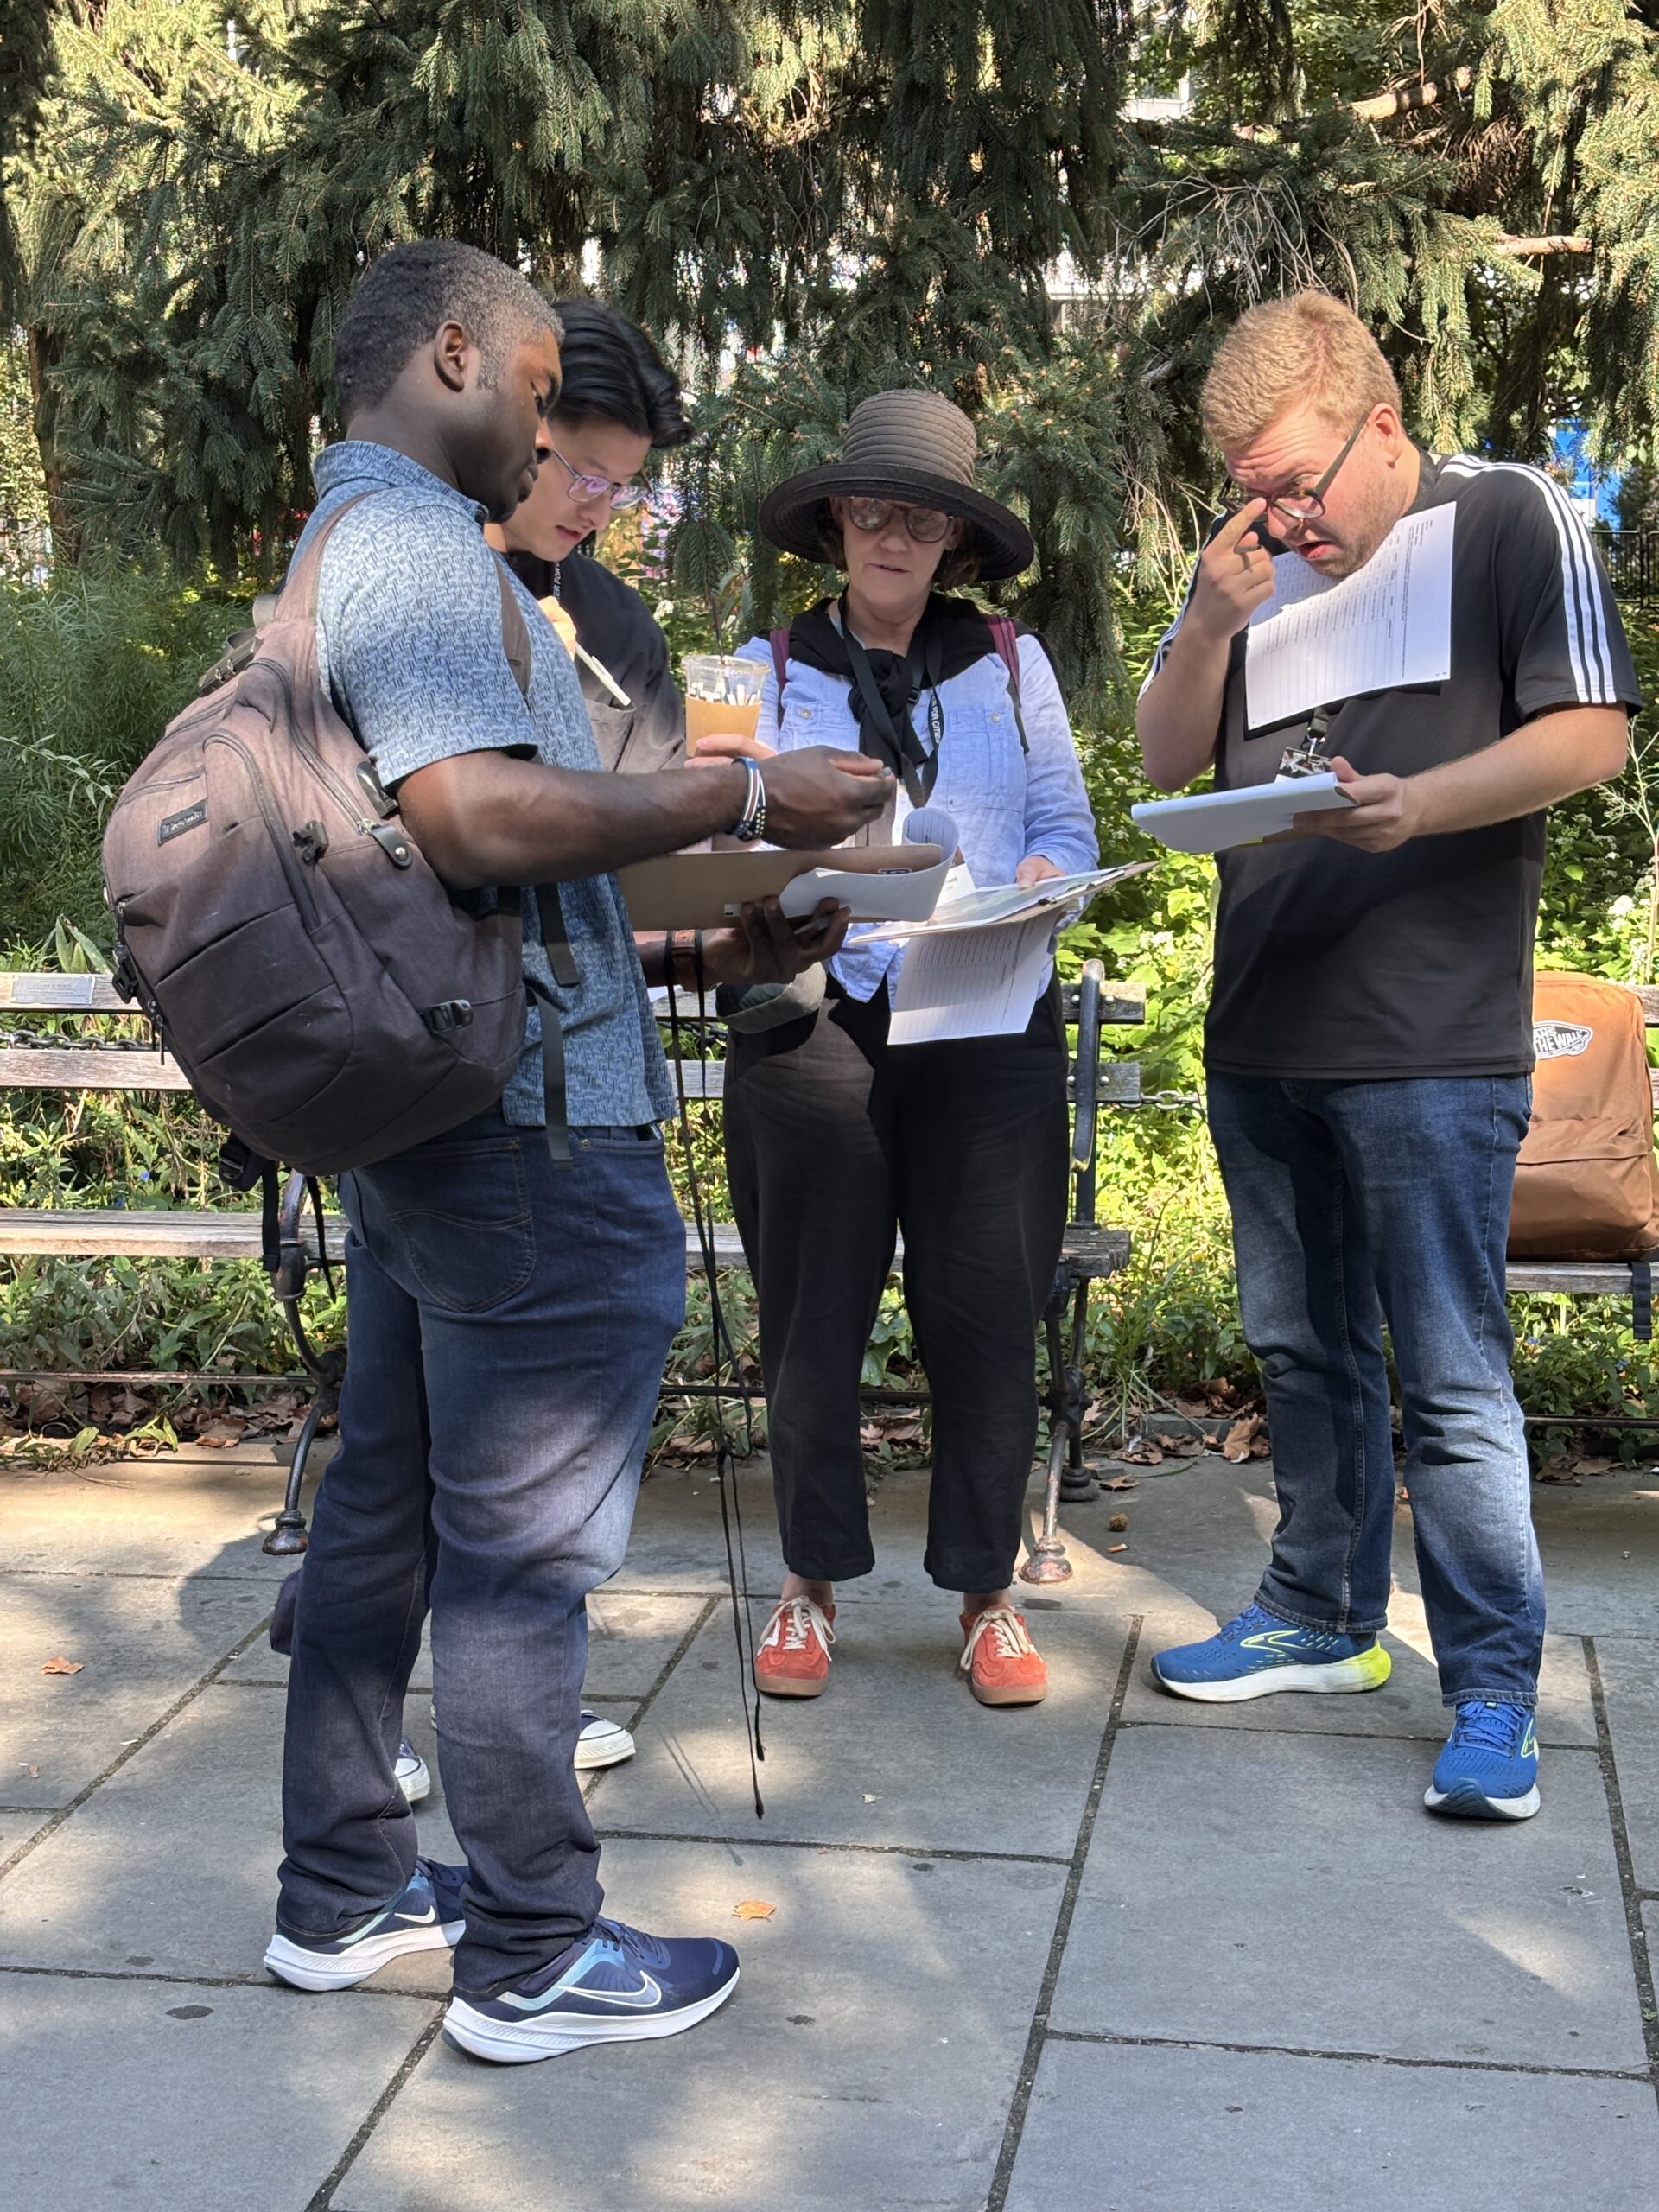
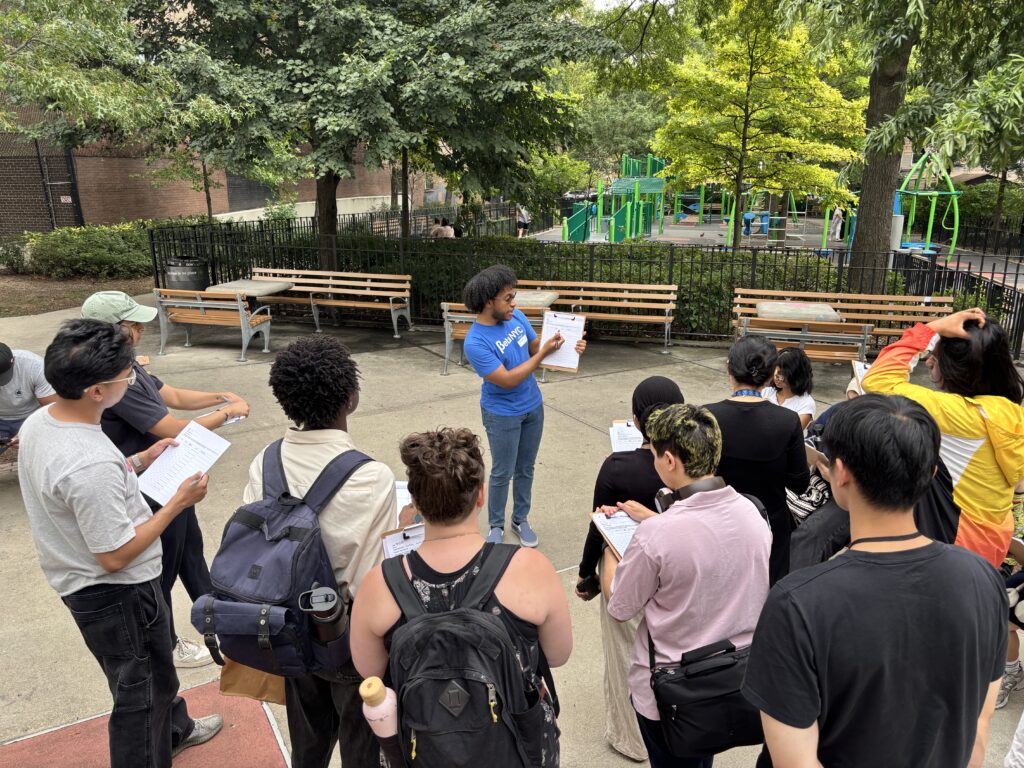
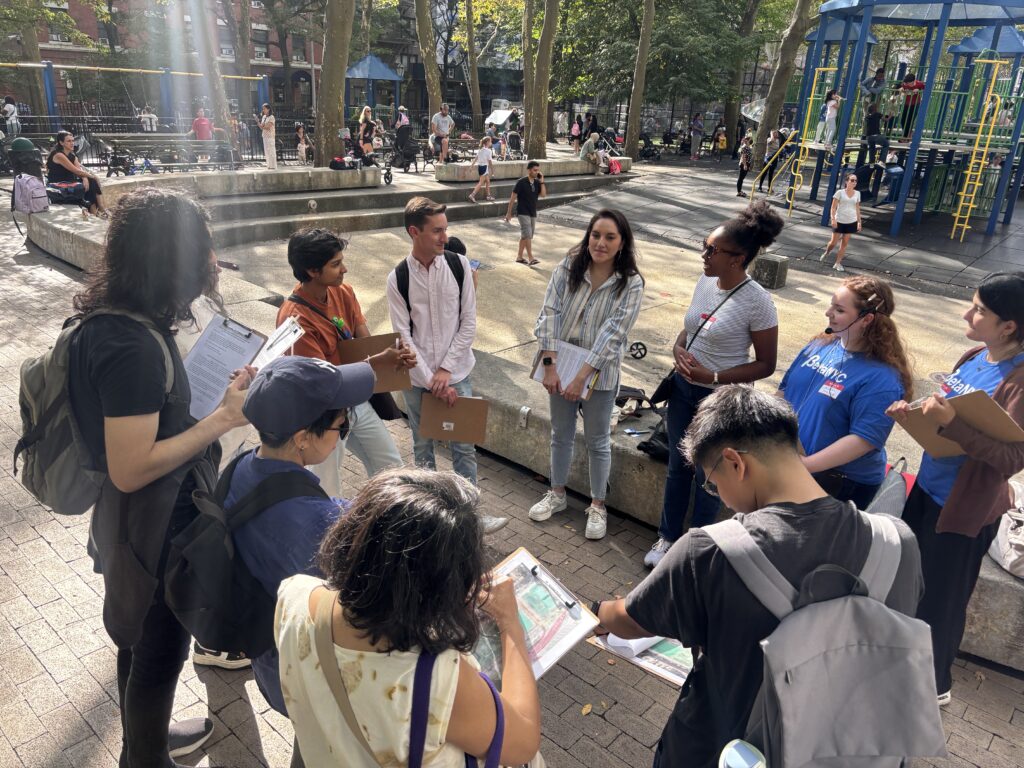
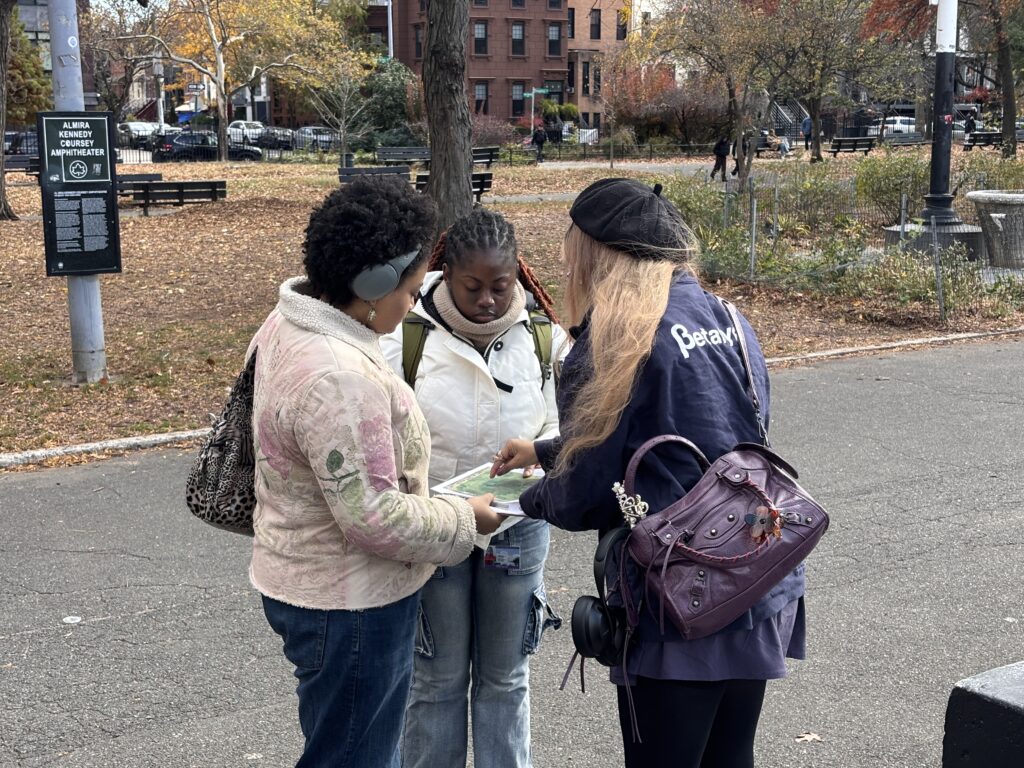
Field Mapping Workshops: We come together at a neighborhood park to practice observation and community-centered data collection. We introduce participants to simple, “analog” mapping tools that make it easy to survey a park and record public amenities like benches, lighting, play structures, bathrooms, water fountains, pathways, and more.
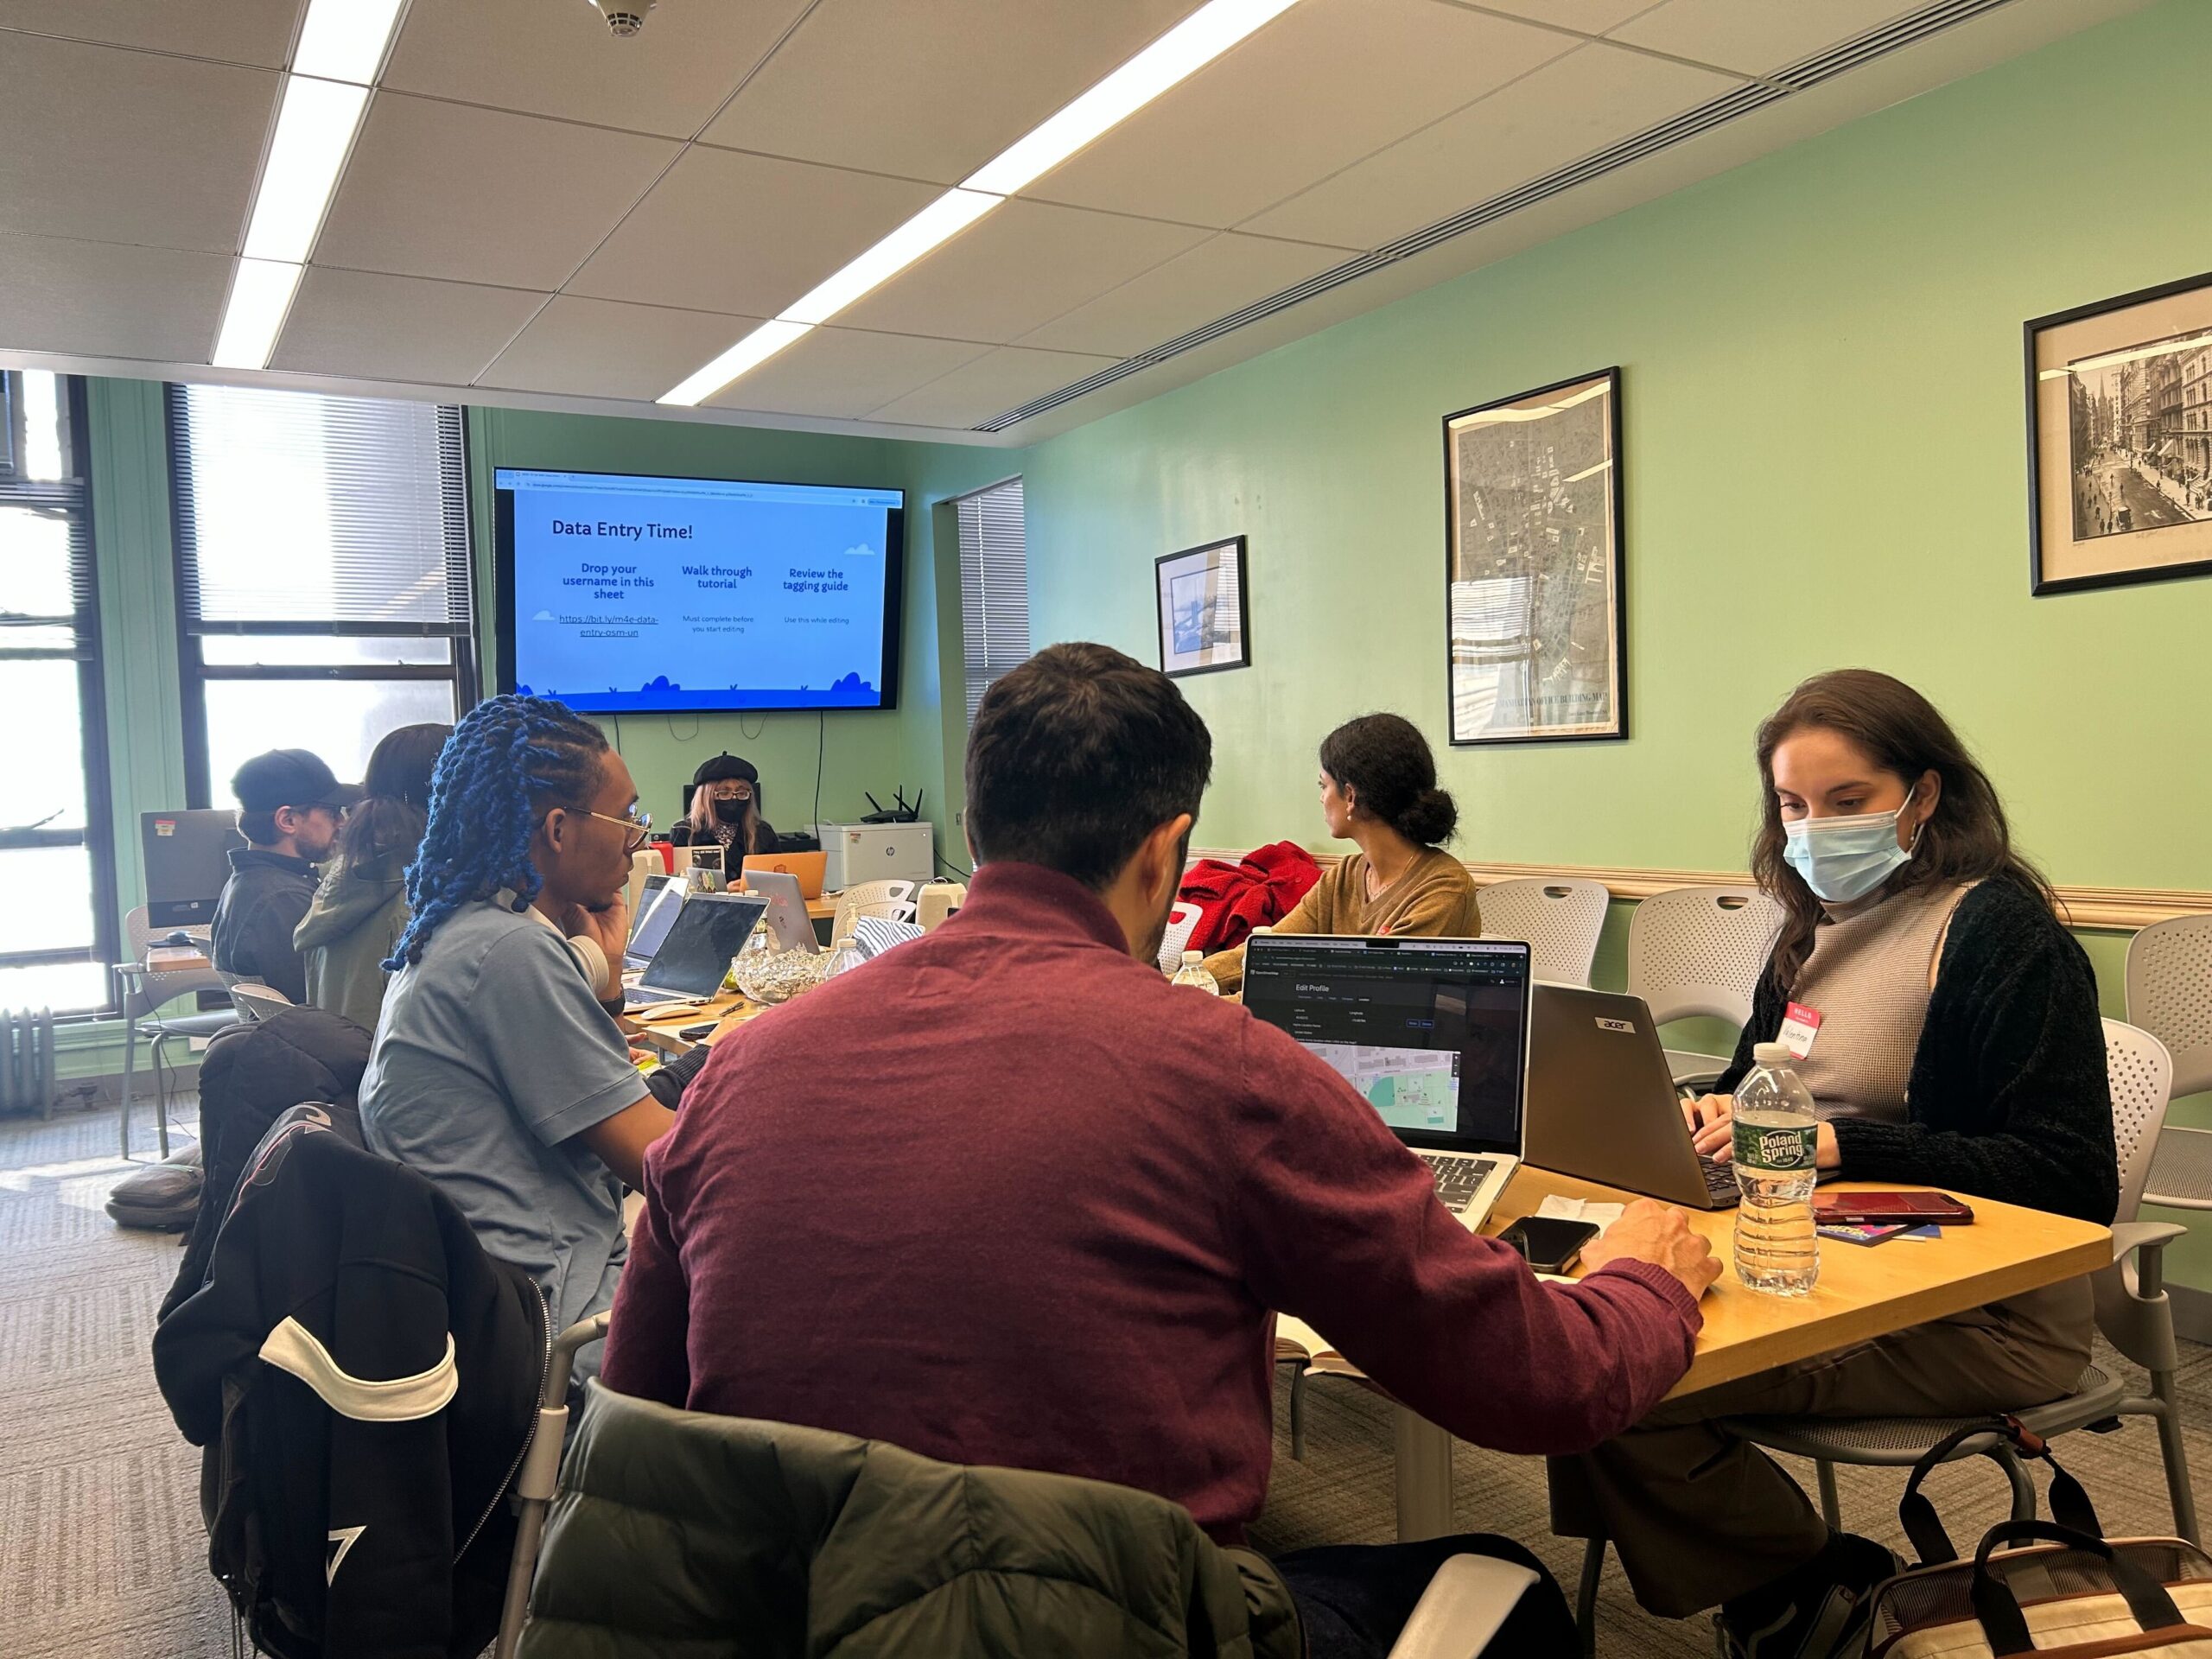
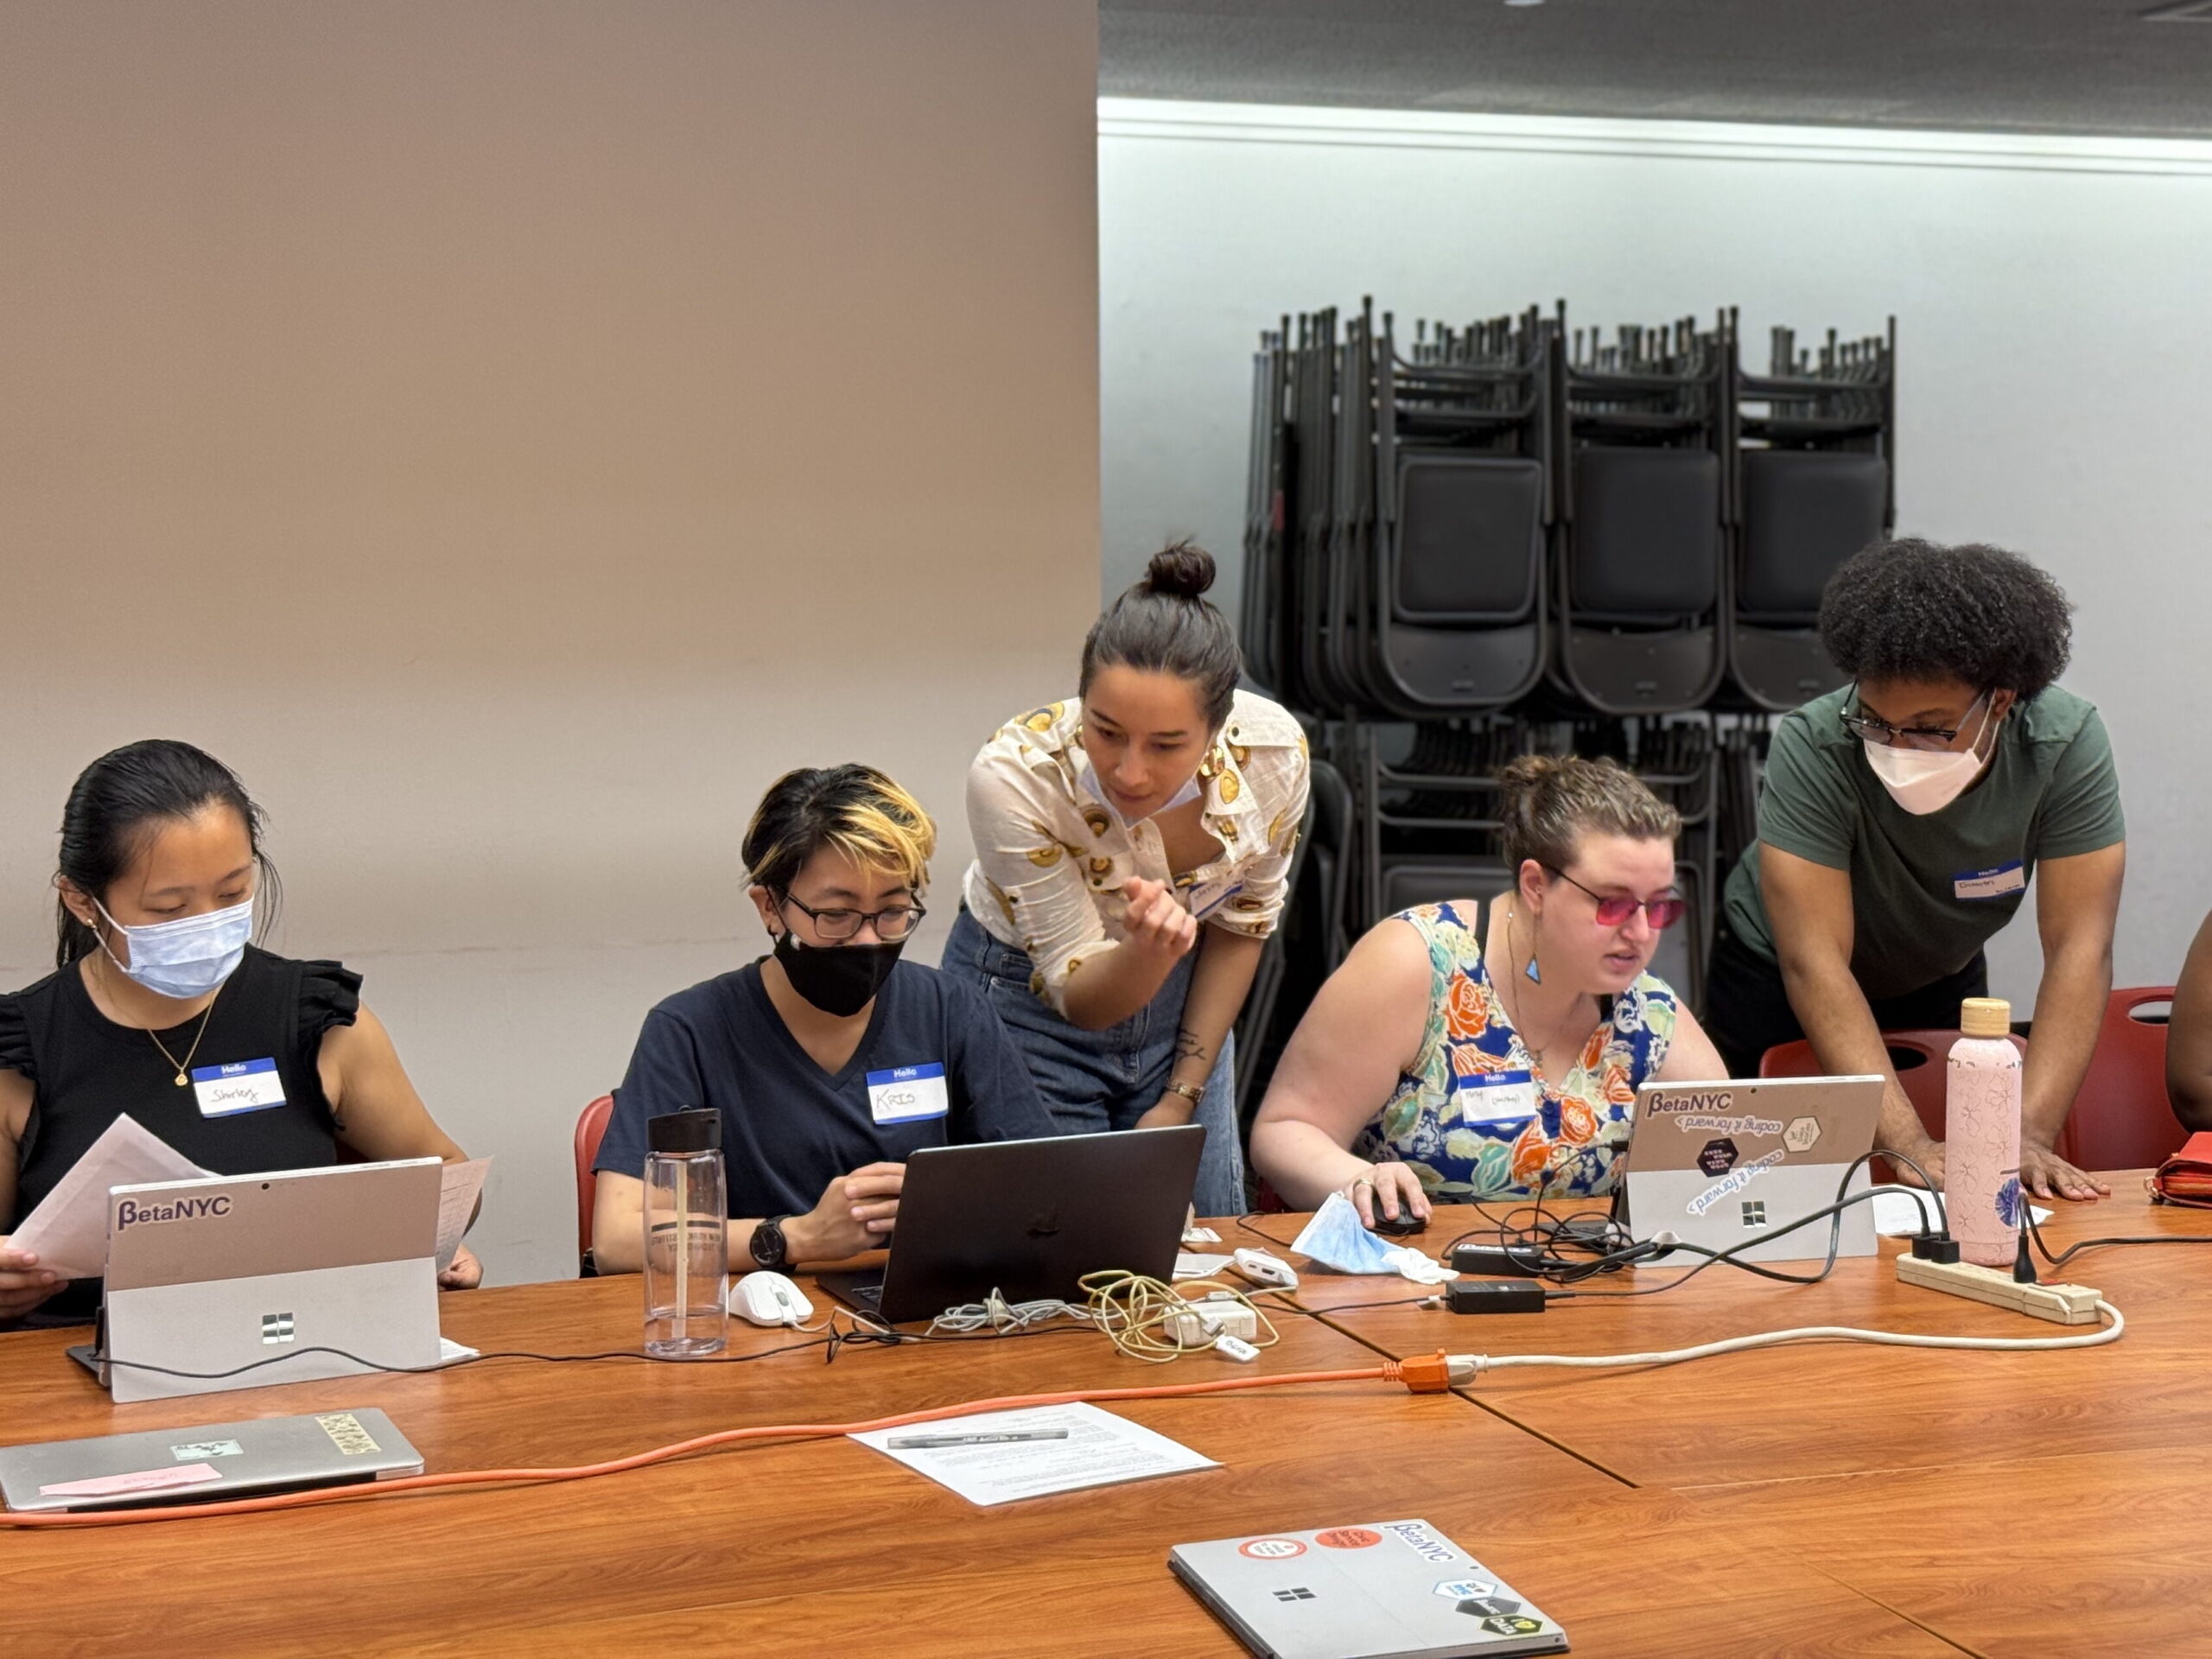
Data Entry Workshops: An indoor activity where we turn the field mapping notes into durable, open data. Participants learn the basics of OpenStreetMap (OSM) and add the public amenity information collected during field events to the virtual map, thus creating free, public data about our shared spaces.
Growing Civic Leaders Through Mapping for Equity
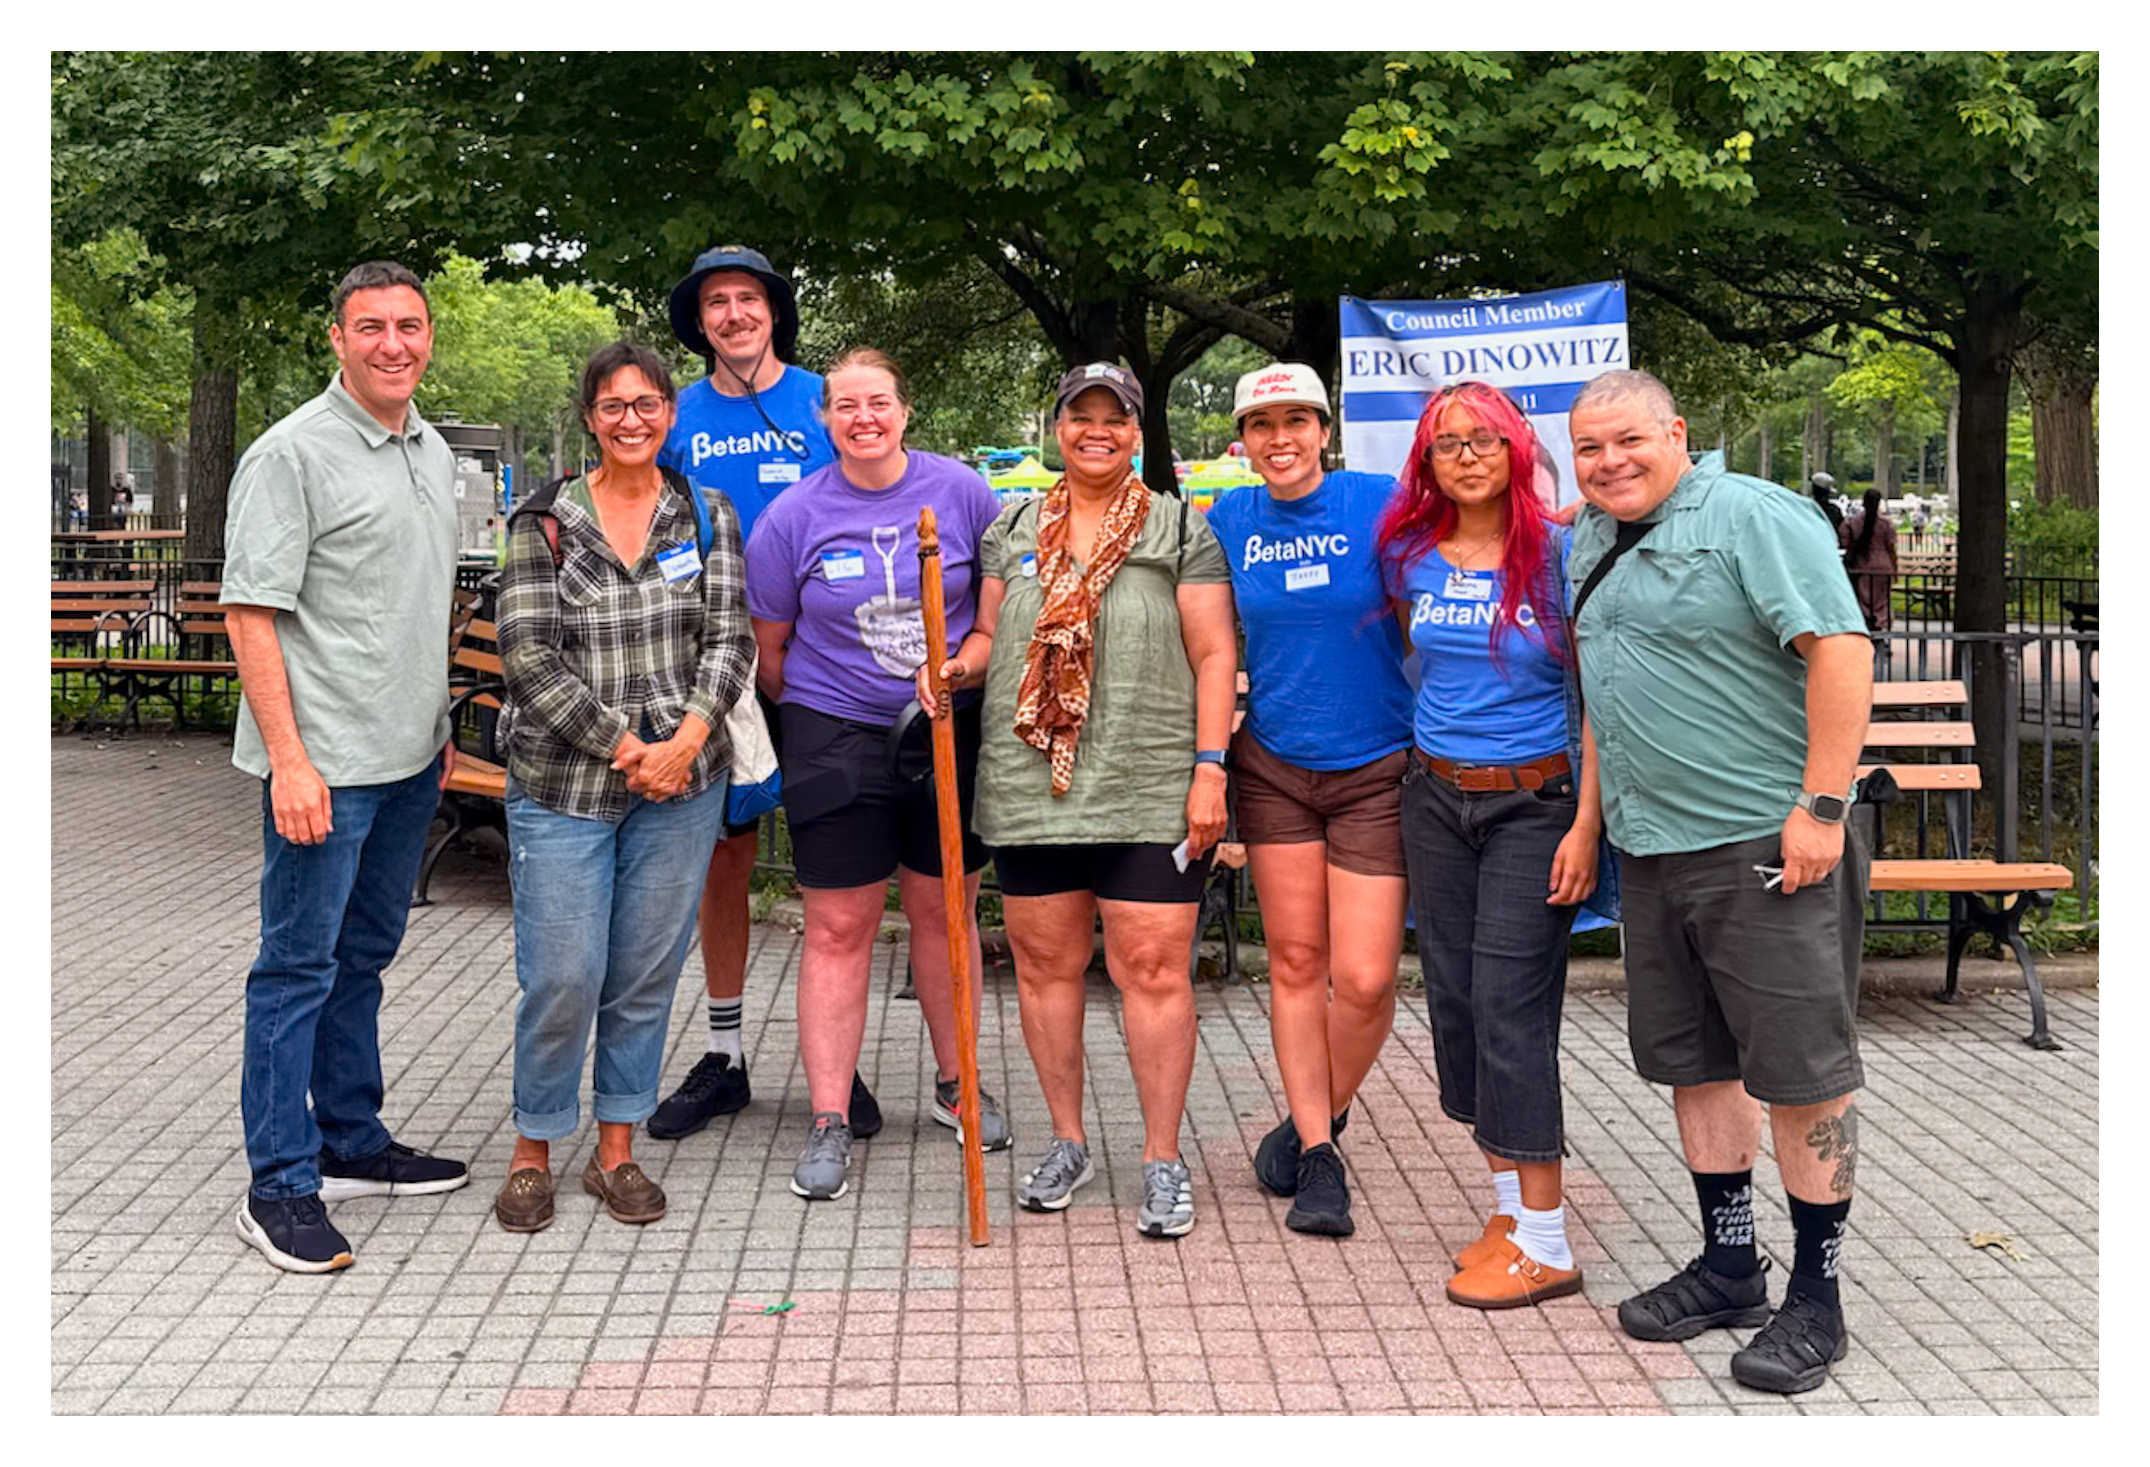
Coming hot off of Open Data Week 2025 and NYC School of Data, the BetaNYC team set a goal to host roughly two Mapping for Equity events each month, either out in the field, or indoors completing data entry. Our staff kicked off with back-to-back June events in partnership with New York City Council Member offices, helping constituents learn the ropes of mapping and how to make the data that surrounds everyone, everywhere tangible.
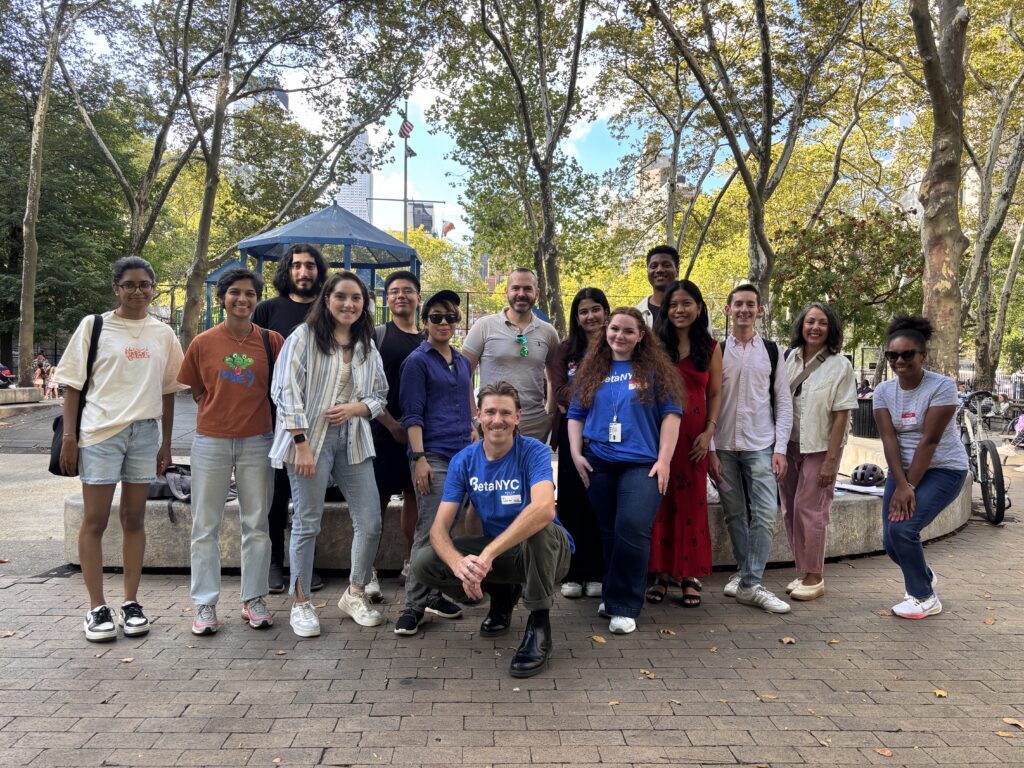
As the season transitioned, BetaNYC welcomed the Fall 2025 Civic Innovation Fellow cohort with College of Staten Island (CSI) students Ayela and Jillian.
A core pillar of BetaNYC’s work is the Civic Innovation Fellowship, where CUNY students are trained as the next generation of civic leaders while contributing to open data and civic projects. For Fall 2025, we wanted to focus on nailing down the cadence and workflow of public events, constantly improving and tweaking the formula with best practices.
Ayela and Jillian quickly stepped into leadership of the Mapping for Equity series, leading outreach to community organizations, facilitating field mapping workshops, and running a final end of year data entry event. This experiential, embodied approach has proven to be one of our most effective training models. Over the course of the semester, they grew into confident leaders, building not only technical mapping skills, but also strong interpersonal and large group facilitation skills.
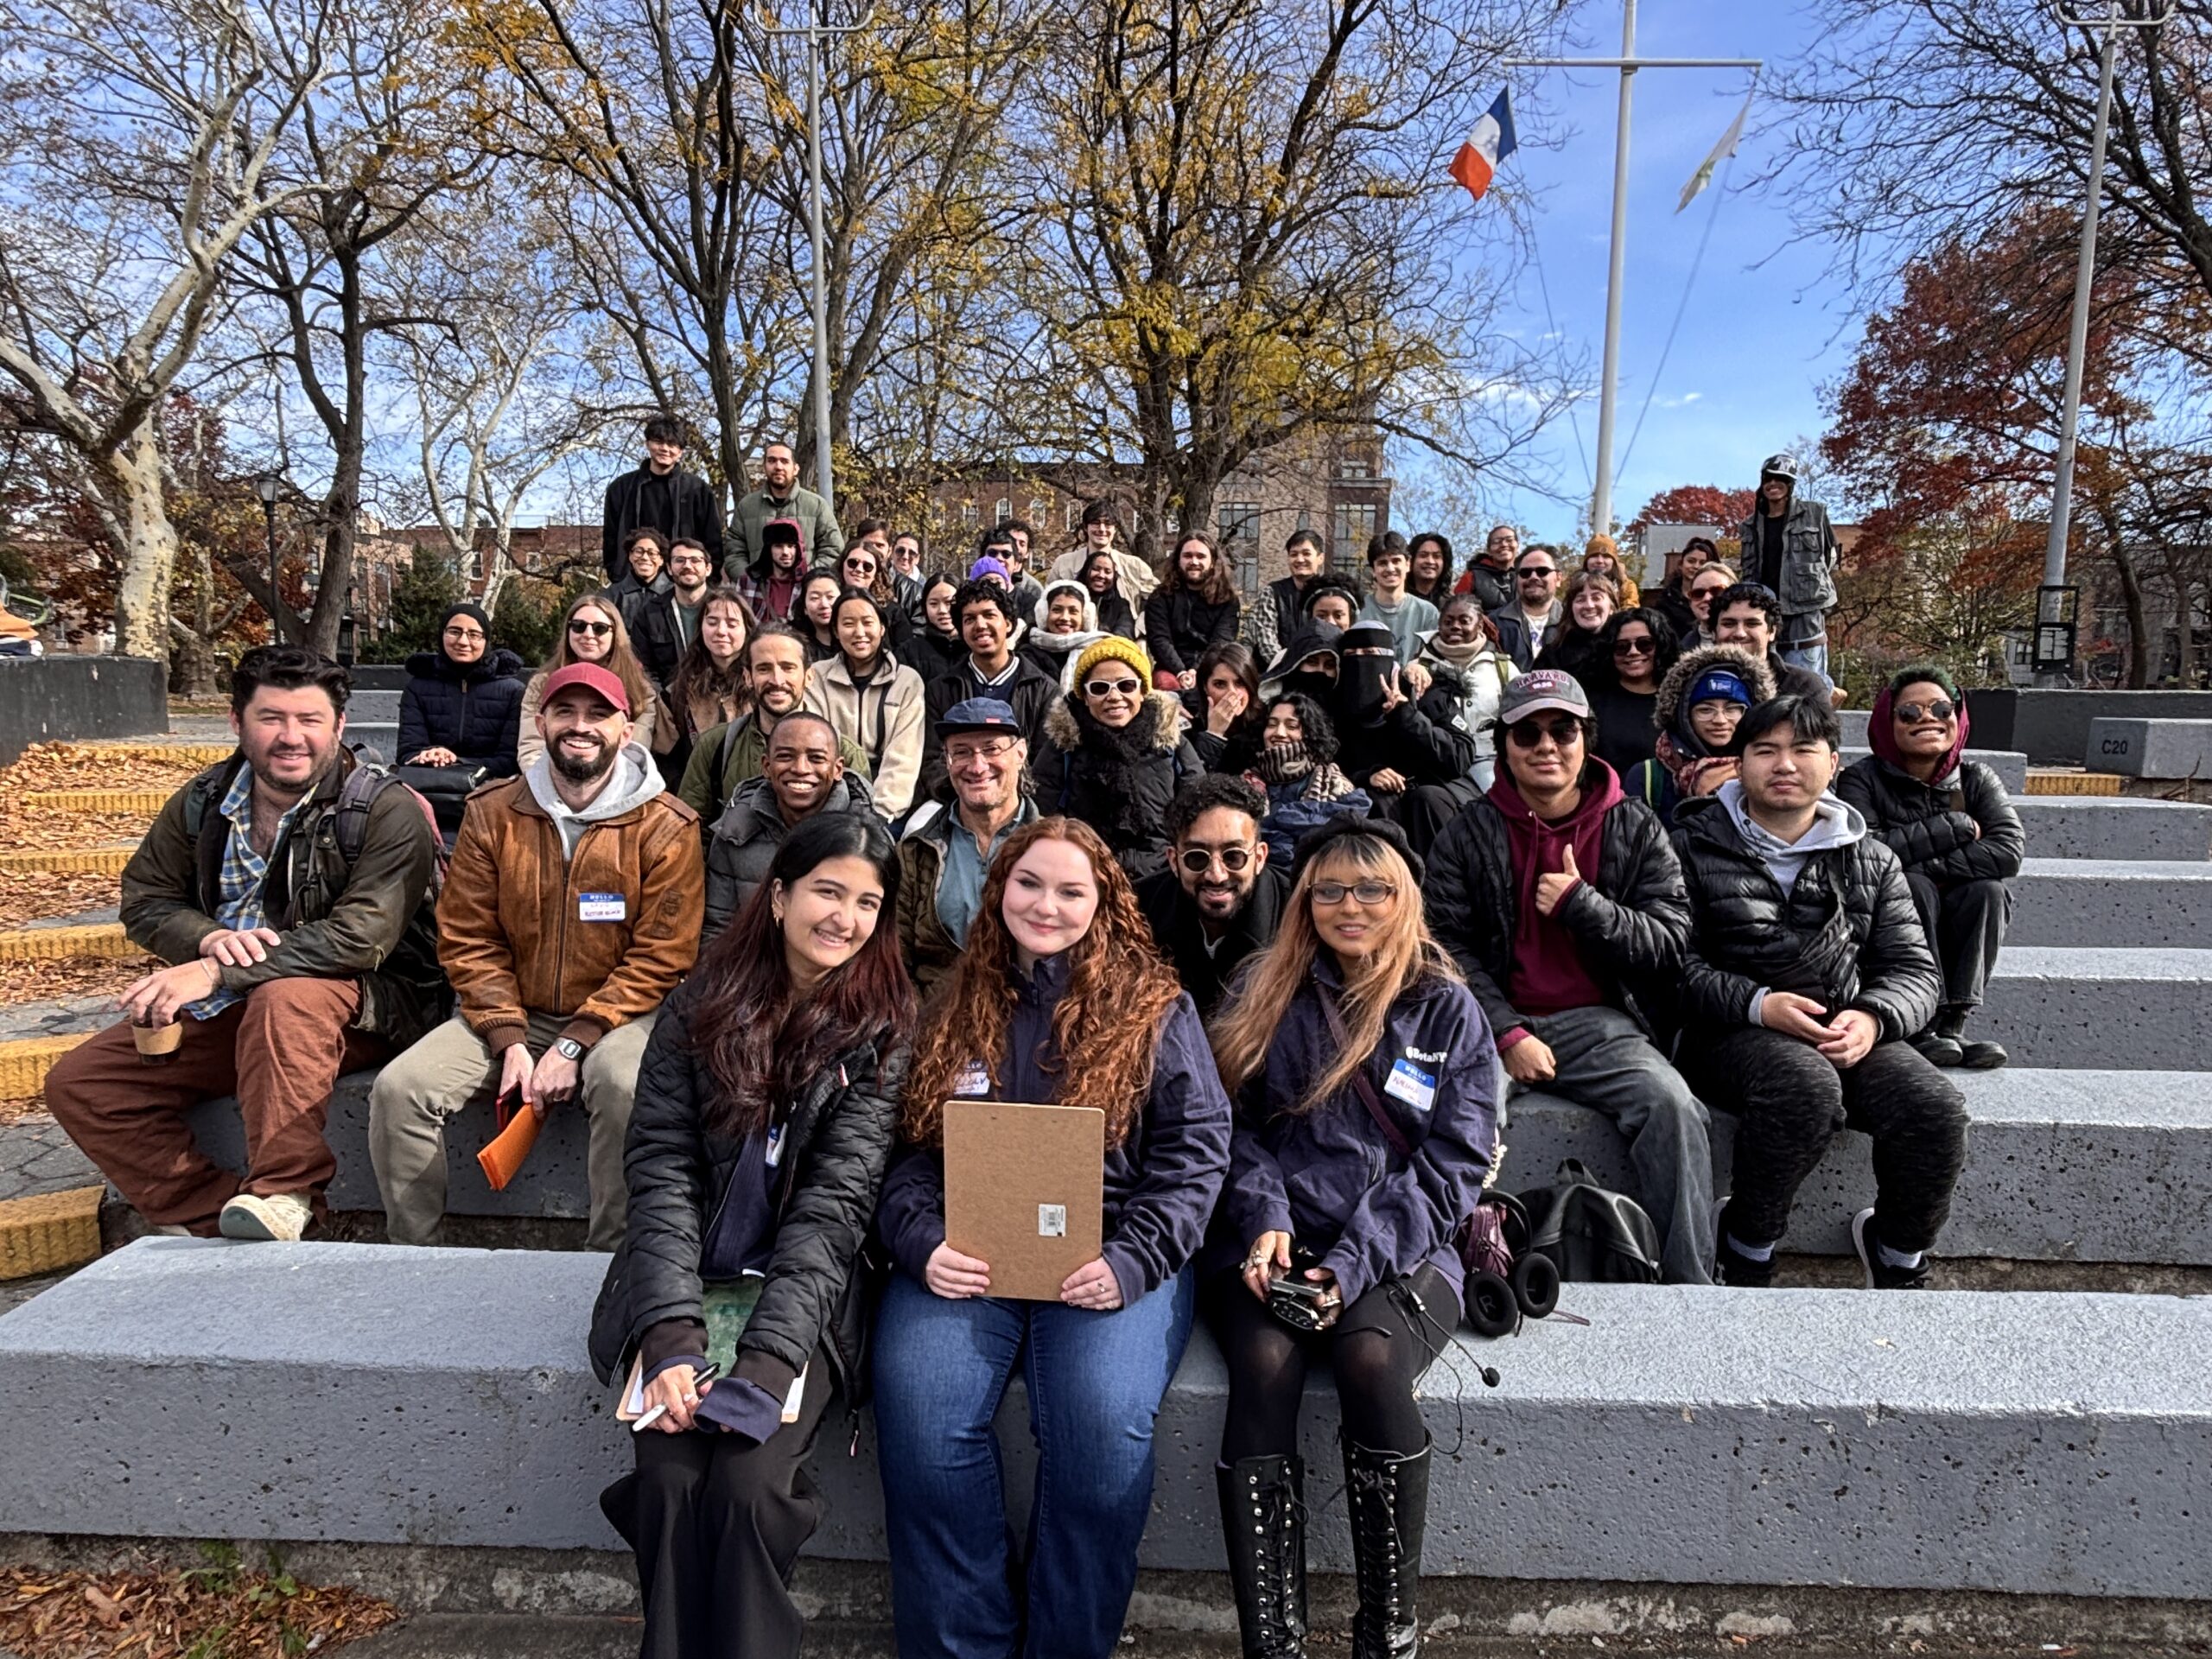
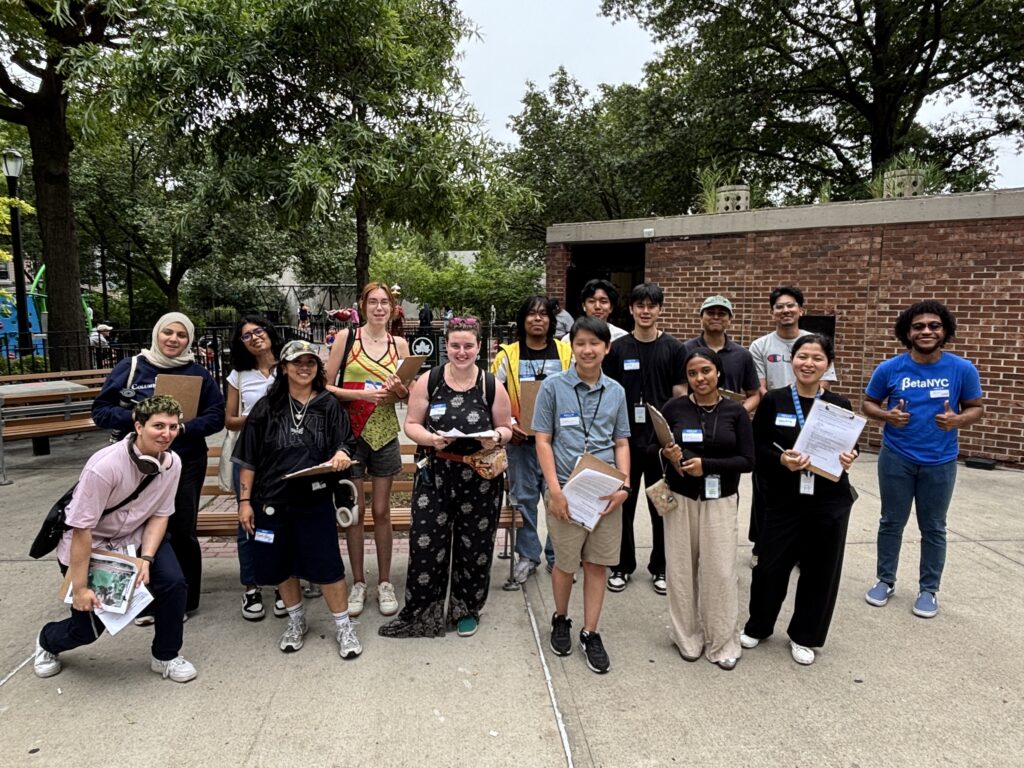
This growth was especially visible at our largest event of the year, which brought forty community members and students together at Herbert Von King Park in Bedford–Stuyvesant, Brooklyn. Working in small teams, participants mapped the park in near record time, demonstrating how student leadership and community-driven work can come together in a highly effective way.
Insights from a Year-Long Sprint Across the City
After running this series from spring through fall, a few clear insights emerged. While the data collection itself is useful, what became fully clear is just how multifaceted the impact of hosting Mapping for Equity events really is. The data collection and digital learning are the entry point for community building. The in person nature of the workshops, paired with a strong connection to place, creates space for people to form stronger relationships with one another. We saw a handful of folks return for more than one Mapping for Equity workshop, simply because they were interested in continuing the work and wanted to stay in community with others who share similar values and interests.


Another recurring theme was the assumption that this data already exists. Participants often asked why city agencies do not already have this information. In some cases, the data does exist, but it lives in disparate systems that are not friendly or accessible without deeper cleaning and technical work. In other cases, the data simply is not collected at all. These events create an opportunity to talk about what accessible data actually means and why having a consolidated, open source home for this information matters. They also open the door to conversations about collaboration, since this work does not have to live in a vacuum and could be shared with agencies if they were open to working alongside community efforts.
“Onsite mapping was an exciting exercise. Physically visiting the site & observing the amenities was a learning experience. Polished my observation skills. Discussions in the office & getting to know the team & work. Team is very good & generous, especially the snacks!”
Another key takeaway was who showed up. The largest group of registrants were students, which is a real strength of the project. Students tend to be motivated and already invested in the positive impact that open data and mapping can have on communities. Participants included students and educators from ten institutions of higher education, including seven CUNY schools, as well as Columbia University, The New School, NYU, and Parsons School of Design. It was also notable that more than one quarter of registrants reported some relationship to a government entity. Since one goal of Mapping for Equity is to influence public policy, having government adjacent participants helps ensure these methods and insights can inform decisions around funding, resources, and quality of life for New Yorkers.
Questions about AI came up frequently, especially around using AI to map faster or more efficiently. These questions helped clarify the purpose of the class. Mapping for Equity is an exposure and learning space where humans are meant to build skills and understanding, rather than a space focused on final products or efficiency. The goal is for people to learn how mapping and data collection work so they can engage more critically with data in the world around them.
Finally, many participants asked what happens next with the data. Will the city or the Parks Department use it? We often point to examples from other places like Lake County and Kendall County in Illinois, where community generated data has been used alongside local agencies. At BetaNYC, our hope is to move toward this kind of partnership locally and to be able to use this data alongside city agencies in ways that are mutually beneficial.

Mapping for Equity 2025 by the Numbers
14 Mapping for Equity events hosted across all five boroughs: Manhattan, Brooklyn, Queens, Staten Island, and the Bronx
- 9 hands on field mapping events
- 5 data entry workshops
134 people trained
Community members trained to map public amenities into OpenStreetMap
682 public amenities mapped
Key amenities documented
• 195 benches
• 105 lampposts and streetlights
• 63 play and youth structures
• 319 additional features including water fountains, gardens, bicycle parking, and public restroomsAcross parks and open spaces throughout New York City
2,942 feet of accessible infrastructure mapped
Paths, sidewalks, and ramps that improve visibility of walkable public space
49,239 square feet mapped
Parks, gardens, community centers, and other public spaces across NYC
| Mapping for Equity Registrant Type | Number of Registrants | Percent of Registrants |
| Student | 48 | 37.8% |
| Private Sector Employee | 24 | 18.9% |
| Employed by the Government | 21 | 16.5% |
| Representative from Community-Based Organization | 19 | 15% |
| Educator | 16 | 12.6% |
| Volunteer for the government | 8 | 6.3% |
| Community Board Member | 6 | 4.7% |
| Government Contractor | 3 | 2.4% |
| Age Range | Number | Percent |
| Under 18 | 1 | 0.7% |
| 18-24 | 37 | 26.6% |
| 25-34 | 49 | 35.3% |
| 35-44 | 20 | 14.4% |
| 45-54 | 18 | 12.9% |
| 55-64 | 12 | 8,6% |
| 65-74 | 1 | 0.7% |
| 75-84 | 1 | 0.7% |
8 parks mapped across NYC
Bronx
- Williamsbridge Oval
Queens
- Big Bush Playground
- Doughboy Plaza
Manhattan
- St. Vartan Park
- Tompkins Square Park
Brooklyn
- Cadman Plaza Park
- Herbert von King Park
- Jackie Robinson Park Playground
7 community partners
- The Better Block Project
- Cadman Park Conservancy
- CUNY PIT Lab
- Divas for Social Justice
- Murray Hill Neighborhood Association
- NYC PIT Pop-Up
- Spitzer School of Architecture
5 City Council partners
- Council Member Julie Won
- Council Member Carlina Rivera
- Council Member Lincoln Restler
- Council Member Eric Dinowitz
“It was a great learning experience for me. I didn’t know that open data existed! This data would be useful for many people in different fields.”
One mapper shared that they were pleased with “the turnout and folks’ diversity of backgrounds! It was encouraging to hear how many walks of life could converge around an interest in community mapping and democratizing data.”
Another mapper hoped this mapping data would be used in the community “to enable better-formed planning and infrastructure investment decisions through more complete, accurate, and up-to-date data!”
Thank you & What’s Next
We are so grateful to the community members, students, partners, and fellows who made Mapping for Equity possible. Their time, trust, and lived experience are what turn open data into something meaningful.
In 2026 BetaNYC will focus on expanding and strengthening Mapping for Equity through a consistent cadence of field mapping events in under mapped neighborhoods, paired with data entry workshops that support high quality contributions to OpenStreetMap, we aim to host at least 20 mapping events and engage more than 200 New Yorkers in hands on mapping and data contribution. We will continue improving and sharing the Mapping for Equity toolkit so educators, organizers, and community groups can host their own events and embed mapping into their ongoing civic work, with a goal of supporting at least 10 community led mapping efforts.
If you are interested in using the Mapping for Equity toolkit or partnering on an event, BetaNYC is actively supporting adoption and handoff. We are committed to helping others build the skills and confidence needed to lead this work independently.
Our dream is to foster a deeper collaboration with local agencies to use OpenStreetMap data as trusted, authoritative data alongside existing systems. Community generated data and government data are strongest when they inform one another. By working toward shared standards and shared goals, we believe Mapping for Equity can help improve how public space is understood, maintained, and funded in ways that better reflect the realities of New Yorkers’ lives